UK Web Focus (Brian Kelly)

Innovation and best practices for the Web

Posts Tagged ‘YouTube’

Video is now a ‘must have’ in Higher Education – but what are the implications for accessibility?

Posted by Brian Kelly on 22 Apr 2014

” Video is now a ‘must have’ in Higher Education”

Video is a 'must have' in HEA recent  tweet from @OpenEduEU (described as ‘Open Education Europa portal is the gateway to European innovative learning’) caught my attention:

RT @RECall_LLP: Video now a ‘must have’ in Higher Education? Report by @Kaltura ow.ly/vQeFk #lecturecapture #elearning #edtech

The article was based on a survey which received 550 responses. The respondents were drawn from IT, digital media, instructional design, senior administration and faculty departments of K12 and HE worldwide who completed an online surveyed between January and March 2014.

Is seems that this is broad agreement that “video has a significantly positive impact on all aspects of the student lifecycle, from attracting and retaining students to enhancing learning, boosting learning outcomes and building stronger alumni relations“.

Note that the full report can be downloaded after completing a registration form.

It should be noted that the report has been published by a company called Kaltura which describes itself as “The leading video platform: video solutions, software and services for video publishing, management, syndication and monetization“. A cynic might suggest that the company has a vested interest in commissioning a survey which show significant interest in use of video in higher education. I feel that the implications of the survey findings are worth considering but it would be helpful to have evidence of the popularity of video usage in the UK higher education sector.

YouTube Use in Selected UK Higher Education Institutions

Back in October 2010 in a post entitled How is the UK HE Sector Using YouTube? I explained how “It can be useful for the higher education sector to be able to identify institutional adoption of new services at an early stage so that institutions across the sector are aware of trends and can develop plans to exploit new dissemination channels once the benefits have been demonstrated“.

The post provided benchmark details on YouTube usage statistics for what appeared to be 15 official UK institutional YouTube channels which were easily identifiable at the time, together with details for the University of Bath and the Open University.

A comparison of the usage statistics recorded in the initial survey with the current findings is given in Table 1.

Table 1: Growth of YouTube Usage Across Selected Official UK Universities from October 2010 to April 2014
Institution Total Nos. of Views No. of Subscribers
Oct 2010 Apr 2014 %age
change
Oct
2010
Apr
2014
%age
change
1 Adam Smith College  25,606 1,063,820  4,055% 39 1,758 4,408%
2 Cambridge University 1,189,778 7,200,870  505%  6,921  37,030  435%
3 Coventry University 1,039,817  2,904,121  179%  1,147  3,668 220%
4 Cranfield School of Management      20,607  459,196  2,128%      82  1,502  1,732%
5 Edinburgh University    236,884 1,759,174  643%  1,280  9,338 630%
6 Imperial College    353,355 2,682,861  659%     859  8,131  847%
7 LSBF (London School of
Business and Finance)
     96,212  676,297  603%     244  2,778  1,039%
8 Leeds Metropolitan University    589,659 1,675,534  184%     512  2,465  381%
9 Nottingham University    284,820 2,151,187  655%     596  7,038  1,081%
10 The Open University    392,720    872,706  122%  2,944  16,562  463%
11 Said Business School,
University of Oxford
   660,541  1,545,331  134%  1,808  6,598 265%
 12 St George’s, University of London    338,276  1,209,538   258%     825  2,650      221%
 13 UCL    287,198 1,491,114  419%     810  5,718  606%
 14 University of Derby    117,906  758,874  544%     106  1,144 979%
15 University of Warwick     90,608 439,492   385%     276  1,520 451%
TOTALS  5,722,987 26,890,115    370%  18,449  107,900 485%

The survey carried out in October 2010 also provided statistics for additional UK University YouTube accounts which were found. A comparison with the current findings is given in Table 2.

Table 2: Growth of YouTube Usage Across Selected UK Universities from October 2010 to April 2014
Institution Total Nos. of Views No. of Subscribers
Oct 2010 Apr 2014 %age
change
Oct
2010
Apr
2014
%age
change
1 University of Bristol     18,171     56,651     212%     27      83     207%
2 Coventry University (CovStudent) 1,036,671 2,904,121     181% 1,139 3,668     222%
3 RHULLibrary       3,847      8,000     108%     10      27    170%
4 Aston University      (89,080)      –  –  (132)  –   –
5 UoL International Programmes 74,017 1,522,574  1,957% 499 5,640 1,030%
6 University of Greenwich          9,254     388,501   4,098%      19    712   3,647%
7 Northumbriauni          6,226     389,268   6,104%      23    412   1,691%
8 Huddersfield University International study 24,195 76,373     216% 22 111 405%
9 The University of Leicester 246,986 2,304,959 833% 320 5,019 1,468%
10 University of Kent 26,996 178,207 560% 102 935 817%
11 Canterbury Christ Church University 25,439 60,755 139% 36 244 578%
 12 Open University     391,625    872,706   139% 2,936 16,557      464%
 13 University of Bath 252,850 675,769   167% 93 1,196 1,186%
TOTALS 2,116,277 9,438,244  346%  5,226  34,604 562%

Note that the channel for Aston University from the initial survey no longer exists. In order to provide comparable statistics the data from the initial survey has been omitted. Also note that the data in the tables was collected on 7 October 2010 and 20 April 2014.

Reflections

The tables provide evidence of the, perhaps unsurprising, popularity of video usage in the UK higher education sector.

It should be pointed out that this information is based solely on use of YouTube. Institutions are likely to make use of a number of other video delivery services (the University of Leeds, for example, has an official YouTube channel which has 246,989 views and 949 subscribers and also a Lutube video service which currently hosts 3,447 public videos, although no download statistics appear to be available). Based on the sample evidence it would appear that we can agree with the statement “Video is now a ‘must have’ in Higher Education“.

This will have many implications for the sector including the question of what video management and delivery tools should be used. But in this post I wish to focus on the accessibility implications of greater use of video resources.

Accessibility Considerations

Institutional Accessibility Policy Statements

In a recent webinar on ‘MOOCs and Inclusive Practice’  I gave a brief presentation on Accessibility, Inclusivity and MOOCs: What Can BS 8878 Offer?.

University accessibility statementIn the presentation I suggested that institutional accessibility policy statements were likely to be based on WCAG conformance. A quick search for accessibility policies available at http:///foo.ac.uk/accessibility helped me to identify two ways in which WCAG policies are used:

  1. The University is committed to ensuring the all web pages are compliant with WCAG guidelines
  2. The University will seek to ensure the all web pages are compliant with WCAG guidelines

But are policy statements such as (1) achievable in an environment in which significant use is made of video resources? Will all video resources used on institutional web sites be captioned? In light of the greater use of video resources, it would appear to be timely to revisit accessibility statements – it should be noted, for example, that according to the Internet Archive the policy statement shown above is unchanged since at least September 2009.

But would a policy statement of the type shown in (2) be appropriate? Such statement do appear to be very vague. Are there not alternatives between these two extremes?

The Potential for BS 8878

In  my presentation on Accessibility, Inclusivity and MOOCs: What Can BS 8878 Offer? (which is available on Slideshare and embedded below) I suggested that the sector should explore the relevance of BS 8878 Web Accessibility Code of Practice, a British Standard which provides a framework in which appropriate policies can be determined for use in the development and deployment of Web products.

Due to the lack of time during the webinar it was not possible to discuss the details of how BS 8878 could be used in an elearning context. However at the Cetis 2014 conference on Building the Digital Institution I will be co-facilitating with Andy Heath  a session which will address the challenge of Building an Accessible Digital Institution. In this session we will “explore how the BS 8878 Web Accessibility Code of practice may address limitations of the WAI approach and see how BS 8878 may be applied in a learning context” and go on to “explore emerging emerging models of accessibility and developing architectures and technical standards“.

Note that the early bird rate (£100 for the 2-day event) for the conference is available until 1 May. I hope that those who have an interest in accessibility for elearning, as well as in the broad range of learning issues which will be addressed at the conference, will consider attending the event.  In the meantime I’d be interested to hear what your current policies and practices are for the accessibility of your elearning resources and, in particular, whether your practices reflect the policies. Feel free to leave a comment on this post.


View Twitter conversations and metrics using: [Topsy] – [bit.ly]

Posted in Accessibility, Evidence | Tagged: | 5 Comments »

Video is now a ‘must have’ in Higher Education – but what are the implications for accessibility?

Posted by Brian Kelly on 22 Apr 2014

” Video is now a ‘must have’ in Higher Education”

Video is a 'must have' in HEA recent  tweet from @OpenEduEU (described as ‘Open Education Europa portal is the gateway to European innovative learning’) caught my attention:

RT @RECall_LLP: Video now a ‘must have’ in Higher Education? Report by @Kaltura ow.ly/vQeFk #lecturecapture #elearning #edtech

The article was based on a survey which received 550 responses. The respondents were drawn from IT, digital media, instructional design, senior administration and faculty departments of K12 and HE worldwide who completed an online surveyed between January and March 2014.

Is seems that this is broad agreement that “video has a significantly positive impact on all aspects of the student lifecycle, from attracting and retaining students to enhancing learning, boosting learning outcomes and building stronger alumni relations“.

Note that the full report can be downloaded after completing a registration form.

It should be noted that the report has been published by a company called Kaltura which describes itself as “The leading video platform: video solutions, software and services for video publishing, management, syndication and monetization“. A cynic might suggest that the company has a vested interest in commissioning a survey which show significant interest in use of video in higher education. I feel that the implications of the survey findings are worth considering but it would be helpful to have evidence of the popularity of video usage in the UK higher education sector.

YouTube Use in Selected UK Higher Education Institutions

Back in October 2010 in a post entitled How is the UK HE Sector Using YouTube? I explained how “It can be useful for the higher education sector to be able to identify institutional adoption of new services at an early stage so that institutions across the sector are aware of trends and can develop plans to exploit new dissemination channels once the benefits have been demonstrated“.

The post provided benchmark details on YouTube usage statistics for what appeared to be 15 official UK institutional YouTube channels which were easily identifiable at the time, together with details for the University of Bath and the Open University.

A comparison of the usage statistics recorded in the initial survey with the current findings is given in Table 1.

Table 1: Growth of YouTube Usage Across Selected Official UK Universities from October 2010 to April 2014
Institution Total Nos. of Views No. of Subscribers
Oct 2010 Apr 2014 %age
change
Oct
2010
Apr
2014
%age
change
1 Adam Smith College  25,606 1,063,820  4,055% 39 1,758 4,408%
2 Cambridge University 1,189,778 7,200,870  505%  6,921  37,030  435%
3 Coventry University 1,039,817  2,904,121  179%  1,147  3,668 220%
4 Cranfield School of Management      20,607  459,196  2,128%      82  1,502  1,732%
5 Edinburgh University    236,884 1,759,174  643%  1,280  9,338 630%
6 Imperial College    353,355 2,682,861  659%     859  8,131  847%
7 LSBF (London School of
Business and Finance)
     96,212  676,297  603%     244  2,778  1,039%
8 Leeds Metropolitan University    589,659 1,675,534  184%     512  2,465  381%
9 Nottingham University    284,820 2,151,187  655%     596  7,038  1,081%
10 The Open University    392,720    872,706  122%  2,944  16,562  463%
11 Said Business School,
University of Oxford
   660,541  1,545,331  134%  1,808  6,598 265%
 12 St George’s, University of London    338,276  1,209,538   258%     825  2,650      221%
 13 UCL    287,198 1,491,114  419%     810  5,718  606%
 14 University of Derby    117,906  758,874  544%     106  1,144 979%
15 University of Warwick     90,608 439,492   385%     276  1,520 451%
TOTALS  5,722,987 26,890,115    370%  18,449  107,900 485%

The survey carried out in October 2010 also provided statistics for additional UK University YouTube accounts which were found. A comparison with the current findings is given in Table 2.

Table 2: Growth of YouTube Usage Across Selected UK Universities from October 2010 to April 2014
Institution Total Nos. of Views No. of Subscribers
Oct 2010 Apr 2014 %age
change
Oct
2010
Apr
2014
%age
change
1 University of Bristol     18,171     56,651     212%     27      83     207%
2 Coventry University (CovStudent) 1,036,671 2,904,121     181% 1,139 3,668     222%
3 RHULLibrary       3,847      8,000     108%     10      27    170%
4 Aston University      (89,080)      –  –  (132)  –   –
5 UoL International Programmes 74,017 1,522,574  1,957% 499 5,640 1,030%
6 University of Greenwich          9,254     388,501   4,098%      19    712   3,647%
7 Northumbriauni          6,226     389,268   6,104%      23    412   1,691%
8 Huddersfield University International study 24,195 76,373     216% 22 111 405%
9 The University of Leicester 246,986 2,304,959 833% 320 5,019 1,468%
10 University of Kent 26,996 178,207 560% 102 935 817%
11 Canterbury Christ Church University 25,439 60,755 139% 36 244 578%
 12 Open University     391,625    872,706   139% 2,936 16,557      464%
 13 University of Bath 252,850 675,769   167% 93 1,196 1,186%
TOTALS 2,116,277 9,438,244  346%  5,226  34,604 562%

Note that the channel for Aston University from the initial survey no longer exists. In order to provide comparable statistics the data from the initial survey has been omitted. Also note that the data in the tables was collected on 7 October 2010 and 20 April 2014.

Reflections

The tables provide evidence of the, perhaps unsurprising, popularity of video usage in the UK higher education sector.

It should be pointed out that this information is based solely on use of YouTube. Institutions are likely to make use of a number of other video delivery services (the University of Leeds, for example, has an official YouTube channel which has 246,989 views and 949 subscribers and also a Lutube video service which currently hosts 3,447 public videos, although no download statistics appear to be available). Based on the sample evidence it would appear that we can agree with the statement “Video is now a ‘must have’ in Higher Education“.

This will have many implications for the sector including the question of what video management and delivery tools should be used. But in this post I wish to focus on the accessibility implications of greater use of video resources.

Accessibility Considerations

Institutional Accessibility Policy Statements

In a recent webinar on ‘MOOCs and Inclusive Practice’  I gave a brief presentation on Accessibility, Inclusivity and MOOCs: What Can BS 8878 Offer?.

University accessibility statementIn the presentation I suggested that institutional accessibility policy statements were likely to be based on WCAG conformance. A quick search for accessibility policies available at http:///foo.ac.uk/accessibility helped me to identify two ways in which WCAG policies are used:

  1. The University is committed to ensuring the all web pages are compliant with WCAG guidelines
  2. The University will seek to ensure the all web pages are compliant with WCAG guidelines

But are policy statements such as (1) achievable in an environment in which significant use is made of video resources? Will all video resources used on institutional web sites be captioned? In light of the greater use of video resources, it would appear to be timely to revisit accessibility statements – it should be noted, for example, that according to the Internet Archive the policy statement shown above is unchanged since at least September 2009.

But would a policy statement of the type shown in (2) be appropriate? Such statement do appear to be very vague. Are there not alternatives between these two extremes?

The Potential for BS 8878

In  my presentation on Accessibility, Inclusivity and MOOCs: What Can BS 8878 Offer? (which is available on Slideshare and embedded below) I suggested that the sector should explore the relevance of BS 8878 Web Accessibility Code of Practice, a British Standard which provides a framework in which appropriate policies can be determined for use in the development and deployment of Web products.

Due to the lack of time during the webinar it was not possible to discuss the details of how BS 8878 could be used in an elearning context. However at the Cetis 2014 conference on Building the Digital Institution I will be co-facilitating with Andy Heath  a session which will address the challenge of Building an Accessible Digital Institution. In this session we will “explore how the BS 8878 Web Accessibility Code of practice may address limitations of the WAI approach and see how BS 8878 may be applied in a learning context” and go on to “explore emerging emerging models of accessibility and developing architectures and technical standards“.

Note that the early bird rate (£100 for the 2-day event) for the conference is available until 1 May. I hope that those who have an interest in accessibility for elearning, as well as in the broad range of learning issues which will be addressed at the conference, will consider attending the event.  In the meantime I’d be interested to hear what your current policies and practices are for the accessibility of your elearning resources and, in particular, whether your practices reflect the policies. Feel free to leave a comment on this post.


View Twitter conversations and metrics using: [Topsy] – [bit.ly]

Posted in Accessibility, Evidence | Tagged: | 4 Comments »

How is the UK HE Sector Using YouTube?

Posted by Brian Kelly on 18 Oct 2010

Profiling UK HE Use of Popular Web 2.0 Services

Following on from recent posts on Planet Facebook Becomes Less of a Walled Garden and What Are UK Universities Doing With iTunesU? the next question should be How is the UK HE Sector Using YouTube? It can be useful for the higher education sector to be able to identify institutional adoption of new services at an early stage so that institutions across the sector are aware of trends and can develop plans to exploit new dissemination channels once the benefits have been demonstrated. I am aware, for example, of failures of institutions to sport the ‘weak signals’ of the importance of the Web in the early 1990s. I have recollections of institutions committing themselves to locally-developed Campus Wide Information Systems (as they were called) or moving to use of Gopher (an Internet technology which was felt to provide benefits of openness which were eventually materials, though with an alternative Internet standard!) but failing to respond to decisions of a small number of institutions who adopted Web technologies in around 1993. Adopting the wrong technologies will, in hindsight, be seen to have been a costly mistake, not just for the individual institutions but also, as we are now very aware of, the tax-payer who ultimately pays for the decisions institutions take.

This recent series of posts therefore aims to identify technologies which are starting to be adopted by institutions, so that we can have a snapshot of how such services are being used. Such an understanding of the trends within the sector can help to inform decision-making, sharing of best practices and also ways in which the return on investment use of new approaches can provide.  Such information will be of importance in demonstrating the value of the decisions the sector makes to politicians, policy makers and  the general public.

ALT’s YouTube Channel

The need to identity ways in which YouTube is being used within the sector occurred to me after received a tweet about a video of a talk on “When worlds collide – revisiting experiential learning” given by Martin Hall, Vice-Chancellor of the University of Salford presented at the ALT-C 2010 conference. From the page about this video I discovered the ALT’s Not-for-profit YouTube channel. This channel is “edited by Matt Lingard, web participation specialist on the ALT Publications Committee. Videos are uploaded and links made that serve to support ALT’s charitable objective, which is ‘to advance education through increasing, exploring and disseminating knowledge in the field of learning technology for the benefit of the general public’.

At the time of writing (7 October 2010) there are 10 video clips from the ALT-C 2010 conference hosted on this channel, the most popular being the ALT-C 2010 Sugata Mitra (457 views) followed by ALT-C 2010 Donald Clark (320 views).

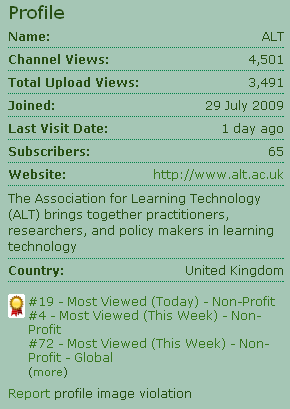
The ALT YouTube channelIn addition to the ALT-C 2010 playlist the channel also has playlists for ALT-C 2009ALT – EPIGEUM Video Awards and ALT-C 2008.

YouTube provide various metrics for channels, including information on the numbers of views of the video clips and numbers of subscribers.

In addition, as can be seen in the accompanying image, ranking information is provided, and we can see that the ALT channel is the fourth most viewed non-profit channel in the UK of the week.

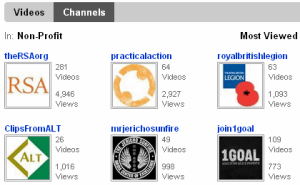
You can also view details of the traffic rankings for the various YouTube categories,  which indicates that theRSAorg, practicalaction and royalbritishlegion channels had the highest viewing figures for the week in which I captured the statistics.

UK University Use of YouTube

The lists of YouTube categories unfortunately doesn’t include Universities, instead having the following rather eclectic lists: Comedians, Directors, Gurus, Musicians, Non-Profit, Partners, Reporters and Sponsors. I therefore had to use YouTube’s search facility in order to identify how UK Universities are using YouTube.  Note, however, that I was subsequently informed that there is a directory of University accounts on YouTube Edu.  I have commented on this directory at the end of this post.

A search for “UK university” revealed the Bath University (my host institution) is in first place with a video in which “Jojo Mayer performs a Masterclass at the Rhythm Course at Bath University” – there have been 199,331 views of this video clip since it was uploaded 3 years ago.

There is a need, however, to be suspicious of searches which reveals that your particular interests are to be found near the top – I suspected that this result reflected my location or profile, although others based elsewhere had similar findings.

Another nearby university, Bristol University, is found in second place. This example, “Bristol University, UK – Study at Bristol – An introduction to one of the very best and most exclusive” has been provided by the official unibristol YouTube account and there have been  18,025 views.  This was the first official University page I found. I have looked through the search results looking for what appear to be official university accounts. I have excluded individual’s clips about universities and also channels such as TOEFL Destinations: University of Northampton which aren’t about a specific university, although I have included what appears to be departmental accounts if they appear to have an institutional user name. Note that the results given in the following table were found in the first five pages of results for a search for “UK University” – note that many of the results were for the University of Kentucky, which has the abbreviation ‘UK University’!

Institution Channel Views Total Nos. of
Upload Views
Subscribers Channel
Comments
Date Created
1 University of Bristol     915     18,171     27  1 16 December 2008
2 Coventry University (CovStudent) 82,375 1,036,671 1,139 42 26 November 2007
3 RHULLibrary     347       3,847     10  0 08 January 2009
4 Aston University 19,552     89,080    132  2 17 October 2007
5 UoL International Programmes 32,162     74,017   499 17 14 February 2008
6 University of Greenwich     971       9,254     19  1 16 July 2010
7 Northumbriauni     521       6,226     23  1 7 January 2010
8 Huddersfield University International study 1,220      24,195     22  0 15 May 2007
9 The University of Leicester 16,382    246,986    320  1 22 May 2008
10 University of Kent 7,725     26,996    102  7 12 May 2009
11 Canterbury Christ Church University 2,050     25,439     36  0 18 December 2006

Note that ‘Channel views’ is the number of users who have visited a channel page (which contains information about the channel) and the ‘Upload views’ is the total number of views for uploaded videos.

Although I have tried to provide a list based on an objective criterion, I feel it would also be useful if I included details for the University of Bath, my host institution and the Open University, which I know is a significant institutional user of a variety of Web 2.0 services (note that the Open University has three additional official institutional YouTube channels: OU Learn, OU Life and OU Research).

Institution Channel views Total Upload Views: Subscribers: Channel Comments Date Created
 1 University of Bath 5,011 252,850 93 3 9 August 2007
 2 Open University 257,497 391,625 2,936 56 5 July 2007

Official Directory of University Accounts on YouTube Edu

After writing the first draft of this post I realised that it would be useful to find ways of automatically obtaining statistics of institutional use of YouTube across UK Universities. I asked for suggestions on ways of doing this on the Quora question and answer service and received a response for YouTube which provided information on the directory of accounts on the YouTube Edu service. As this directory provides different information from that listed above (the University of Bath account, for example, isn’t included) I have left the details I collected in the above table.

The following 18 accounts are listed in the YouTube Edu directory of UK Universities (and as three are from the Open University this represents 16 institutions, one of which, Said Business School, is part of the University of Oxford):

Adam Smith College – Cambridge University – Coventry UniversityCranfield School of ManagementEdinburgh UniversityImperial College LondonLSBF (London School of Business and Finance)Leeds Metropolitan UniversityNottingham UniversityOpen University (together with Open University – LearnOpen University – LifeOpen University – Research) – Oxford Saïd Business SchoolSt. George’s, University of LondonUniversity College LondonUniversity of DerbyWarwick University

Let’s now summarize the usage statistics for this official list of UK University accounts on YouTube Edu. Note, however, that only a single Open University account is included in the following table.

Ref.
No.
Institution Channel views Total Nos. of
Upload Views
Subscribers: Channel
Comments
Date Created
1 Adam Smith College    4,076     25,606    39  ? April 25, 2009
2 Cambridge University 221,280 1,189,778 6,921  ? September 19, 2006
3 Coventry University   82,937 1,039,817 1,147 42 November 26, 2007
4 Cranfield School of Management    5,189     20,607    82  1 October 12, 2009
5 Edinburgh University   31,388   236,884 1,280  ? November 08, 2008
6 Imperial College   48,307   353,355    859  7 April 24, 2008
7 LSBF (London School of Business and Finance)    6,999     96,212    244  7 August 25, 2008
8 Leeds Metropolitan University   67,014   589,659    512 19 January 07, 2008
9 Nottingham University   35,643   284,820    596 10 February 11, 2009
10 The Open University 258,309   392,720 2,944 56 July 05, 2007
11 Said Business School, University of Oxford   56,066   660,541 1,808 60 December 17, 2007
12 St George’s, University of London   41,983   338,276    825 12 August 20, 2007
13 UCL   47,773   287,198    810 27 May 15, 2009
14 University of Derby    8,578   117,906    106  5 September 22, 2006
15 University of Warwick   17,362    90,608    276  6 March 30, 2009

Observations

The first institutional YouTube channels seem to have been created in September 2006 (Derby University) followed by Canterbury Christchurch (December 2006). The next set of institutional accounts were created in May 2007 (Huddersfield University), July 20087 (Open University), August 2007 (St Georges and Bath University), October 2007 (Aston University), November 2007 (Coventry) and December (Said Business School).

The institution with the largest number of upload views is Cambridge University with 1,189,778 views and Coventry University with 1,039,817 views. Note that such statistics will be skewed in institutions make use of a single institutional YouTube channel or use several (as the Open University does).

It should be noted that the Coventry University account, which has the second largest number of downloads, is provided by students.

What Next?

Having more comprehensive data on the provision and usage YouTube across the sector can be useful in informing decision-making on use of YouTube as a delivery channel and how use of YouTube may relate to the institutional provision of video streaming services in-house (such as the LUTube service provided by the University of Leeds).

There might also be the need to clarify ownership of an official YouTube Edu account – in some cases the account listed in the YouTube Edu directory is used as an e-learning delivery channel (such as the St. Georges Clinical Skills Online channel, in others as a channel to provide a students’ perspective on University life (e.g. the CovStudent channel) whereas others, such as the University of Edinburgh, provide a more traditional official University view with, as in this case, an official welcome from the University Principal.

There may also be the need to share examples of best practices and policies. For example the University of Edinburgh channel states that “Please note, the University does not monitor YouTube comments. Please direct any queries via our website“.  Is this a well-established approach and what are the benefits and possible risks of adopting this approach?

Anyone have any comments or observations on the initial set of data listed above or thoughts on how the HE sector might make use of YouTube Edu?

Posted in Evidence, Web2.0 | Tagged: | 15 Comments »